
Gross Domestic Product, GDP – GDP is a standard measure of the total monetary or total market value of all the final goods and services produced and sold (not resold) by a country in a specific time. It is a standard reference point for checking health & wellness score of a country economy. According to the Economic Co-operation and Development (OECD) defines GDP as “an aggregate measure of production equal to the sum of the gross values added of all resident and institutional units engaged in production and services (plus any taxes, and minus any subsidies, on products not included in the value of their outputs)”.
An IMF publication states that, “GDP measures the monetary value of final goods and services—that are bought by the final user—produced in a country in a given period of time.
GDP is a powerful statistical indicator of country development and progress. It is an indicator of economic progress in a broader sense. This parameter alone can’t be used to measure the cost of living and the inflation rates of a country. This is more useful in comparing national economies.
GDP Per Capita – Gross Domestic Product (GDP) Per Capita shows country’s GDP divided by its total population. It is a country’s economic output per person, it can be linked to country’s standard of living but this is not the exact right parameter for calculating the same because it doesn’t reflect differences & variations in the cost of living and the inflation rates of the countries. For this purpose “GDP Per Capita PPP (Purchasing Power Parity)” is more ideal for comparing living standards between nations.
GDP Per Capita is also called as the Mean Standard of Living. It is generally calculated for a certain period of time, usually one year. Country’s wealth is divided among its population to find GDP per capita. GDP per capita can act as a metric for determining country’s economy per each person living there. Rich countries have high GDP Per Capita especially if they have less population.
Let’s explore “GDP” and “GDP Per Capita” Trends of India over last 61 years (1960 to 2021).
India’s GDP and GDP Per Capita Trends & Patterns –
1. India’s “GDP” over the years from 1960 to 2021 –

As you can see from the above graph, GDP of India grows very slowly from 1960 till 2002. Starting from year 2003, it grows gradually with more pace & consistently. From year 2010, it further speedens up and consistently maintaining a good growth speed.
2. India’s “GDP” growth observation over the years from 1960 to 2021 –

-
- In 1961 India’s GDP was 39.23B$ with Growth rate 3.72% and that is huge for that time of period because in 1960 India had one of the lowest per capita incomes in the world. At the rate of exchange prevailing in 1960, the per capita product at 1958-1959 prices was approximately 60 dollars.
- In some periods between 1860 and 1960 the rate of growth of the economy was high and in other periods it was low (or negative). Indian economy had grew at a low rate during the Inter and Post War periods.
- In 2021 India’s GDP has reached 3173.40B$ with the growth rate of 8.3%. The growth rate is very different from previous year 2020 which is -8.0%(negative), which is evident from the fact the whole world was suffering from “The Great Lockdown” due to Covid Virus Epidemic. After controlling Covid pandemic India’s GDP is recovering well & is estimated to grow further.
“Economists pointed out that real GDP was only ‘a subdued’ 1.5% higher than pre-COVID levels and ascribed the lower than projected full-year growth to the effects of the Omicron variant of COVID-19, high commodity prices and inflation as well as data corrections for the first half of the year”.
3. India’s “GDP Per Capita” growth observation over past 61 years, 1960 to 2021 –

This graph shows the growth of Per Capita Income (PCI) of people in India. Per Capita Income (PCI) or Total Income measures the average income earned per person in a given area (city, region, country, etc.) in a specified year. It is calculated by dividing the total income of the country by its total population.
India’s “GDP Per Capita” for 2021 was $2,277, a 17.81% increase from 2020. India GDP per capita for 2020 was $1,933, a 6.71% decline from 2019 (Because of Covid-19 Pandemic and The Great Lockdown). India GDP per capita for 2019 was $2,072, a 3.7% increase from 2018. India GDP per capita for 2018 was $1,998, a 0.89% increase from 2017. In 1961, GDP per capita was $85, in 1962 it increased to 90$. Moving on, it increased continuously for decades.
Few Key points –
- The India Per Capita Income in 1961 was 85$ with growth rate of 3.72(%), compared to previous year 1960.
- In 1966 India Per capita was 90$, which was a sudden decrease when compared with past few years because of increase in Defence spending in 1965/1966. It was 24.06% of overall expenditure, the highest in the period from 1965 to 1989.
- The India Per Capita Income in 2021 was 2277$ with the Growth rate of 8.85(%) compare to previous year 2020.
4. India’s “GDP Per Capita” growth variations (% Wise) over the years from 1960 to 2021 –
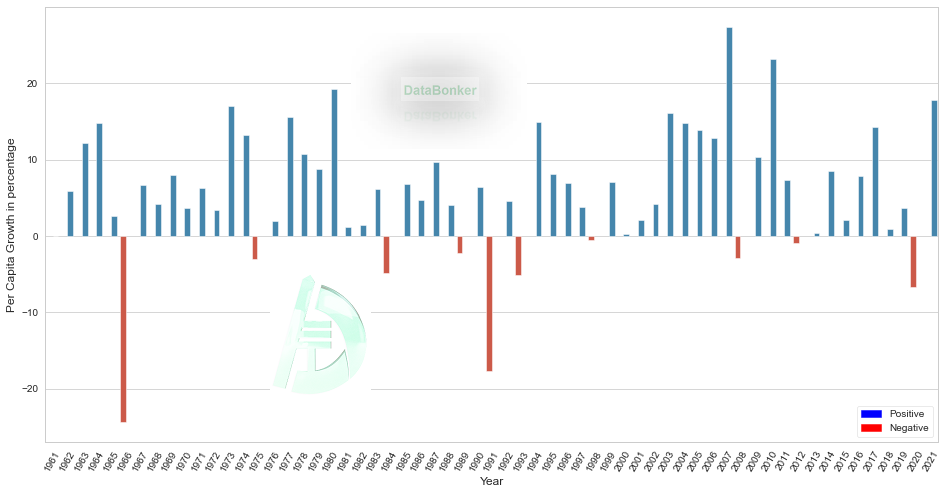
Above graph shows the inconsistency in terms of “GDP Per Capita” growth in India for the last 60 years. There are many ups and downs.
- Growth was maximum in Year 2008 but due to the recession occurred during those years, growth went “-ve” in the subsequent year.
- “GDP Per Capita” was lowest in Year 1966.
- Negative bars showing the respective years with “GDP Per Capita” growth negative in those time periods.
- Growth was negative in Year 2020 because of Covid-19 impact and the lockdown in India & across the globe. After recovering from Covid, growth has been started picking up the pace in India & off course around the world.
=> Above, we present few factors influencing the GDP & GDP Per Capita growth in India. We will be bringing in depth report of it soon. Also, we will be bringing in depth detailed researched report on –
- Asia (Asian Countries) GDP & GDP Per Capita growth trends for past, current & future years.
- World (World Countries) GDP & GDP Per Capita growth trends for past, current & future years.
Hope you liked it. You can explore our Knowledge Base on Technology & Data related topics here –
– Technology And Data Erudition
– Dark Data
For interesting & insightful video trends, patterns & graphics. Do visit here –
– Top 10 World Countries GDP Wise from 1960 to 2021
– Bottom 10 World Countries GDP wise from 1960 to 2021
– Top 10 Asian Countries “GDP Per Capita” Wise 1990 to 2020
– Bottom 10 Asian Countries “GDP Per Capita” Wise